Video
Realized Volatility: It’s more than just ONE number
Realized volatility is a term familiar to anyone who has traded options. You may have heard of jargon like this on the trading floor, or in chat rooms.
“Options are cheap, realized vol is below implied”
“Sell options, realized vols are underperforming”
Options 101– I need my Realized Vol. Let me just look at the realized volatility number that is being shown on my favourite data platform.
But hang on, did you know that there are a multitude of ways to look at realized volatility? Does your data platform show you what suits you?
This blog will cover how to go about choosing your own Simple Realized Volatility metric and how Optimus can help you get it at a click of a button.
1. What is my underlying?
You are looking to trade a 3 month EURUSD option. Should you be looking at the Realized Volatility of EURUSD spot, EURUSD 3 month, or something in between?
There is no right answer, you need to determine works for you better.
If you are going to trade your gamma, then you need to know that the option gives you gamma on the 3 month outright forward on day one.
- in some pairs where forwards are volatile in comparison to spot, choose Forward Realized Vol.
- in other pairs, forward swaps are hugely correlated to spot. Choose Forward Realized Vol.
- in some, forwards do not move or are not volatile in the short end. Here Spot Realized works.
Synoption offers you the ability to choose what series you want the realized volatility on, based on your trading style and preference.
2. How often do I trade?
Realized volatility is a process where you take snapshots of the market, and then calculate the standard deviations of the return.
So you need to determine, how often to take the snapshot as that determines the data that is used for your calculation.
Choosing when and how to take the snapshot can make a difference to the number that is thrown out.
“Why” you may ask. There could be cases where markets chop around but do not really have changes between time periods. The below chart shows an example for three different types of samplings based on frequency or time.
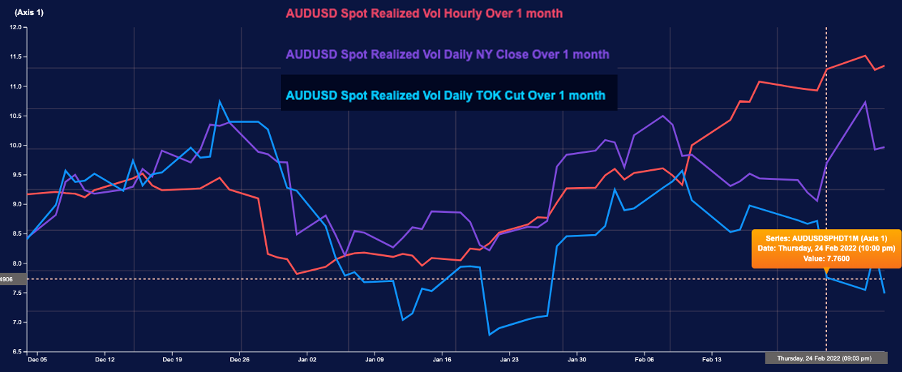
If you trade gamma, choose a frequency that is close to your hedging frequency and time zone.
- Active market makers typically may want more frequent observations like hourly.
- Less active traders may look at it daily.
- If you do not hedge but just hold- well definitely at minimum daily, weekly may work too.
Synoption provides the flexibility to choose different sampling frequencies: hourly, daily TOK Cut, daily NYK Cut, Daily NYK Close, Weekly NYK Close.
3. How much data is relevant?
So now we know how often to sample, but how big should our sample size be? How much data is relevant? How much is predictive of what is going on?
If we use a lot of data points, we may lose touch with the immediate reality of the market. Too small a sample reduces the confidence level. Just because the last three hours were quiet doesn’t mean that markets don’t move.
Optimus allows you to choose different sample sizes based on the frequency.
4. Mean reversion, you say?
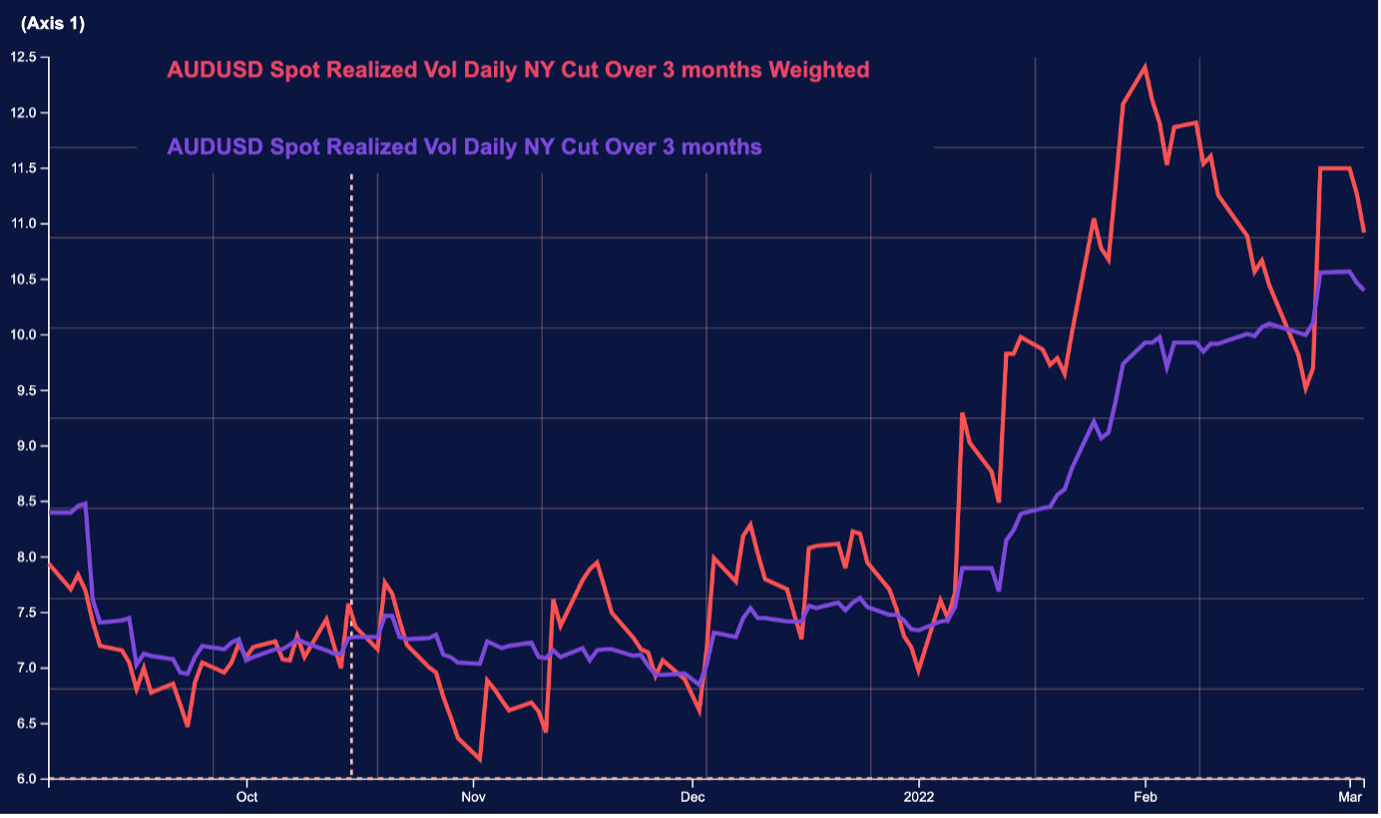
Realized volatility is sometimes thought to be mean reverting, different assets typically are exhibit steady long-term volatility.
Is there a way to get a metric that still has the long-term average built-in, but keeps the recent data more relevant?
Using Optimus, you can use Weighted realized volatility, where more weight is put on recent calculations. In this way, the current market state is blended into the historical mean value.
Own your Realized Volatility
Synoption’s Optimus platform allows you to choose between 150 separate ways of looking at Realized Volatility.
Define your Realized Volatility metric based on your trading style, not on what someone else tells you.
Sign up with SynOption for more cool tools.
Leave a Reply